


There seems to be a lot of comparison to the post-COVID 2022 market sell-off that was fueled by higher rates, inflation, and fear of an economic slowdown. Let’s go with that comparison of today’s increasing interest rate environment and fear of a stock market rollover, despite being just a few percentage points from all-time highs. I’m preparing a reallocation of our portfolios to take advantage of what I think will be the next leg up, though there are so many macro headwinds to tell us we should raise cash in the portfolios and go defensive. It is indeed a very tricky time. Let’s unpack what we see at the hard right edge of the charts to lay out our next moves and NOT rely on what we think or, worse, feel should happen.
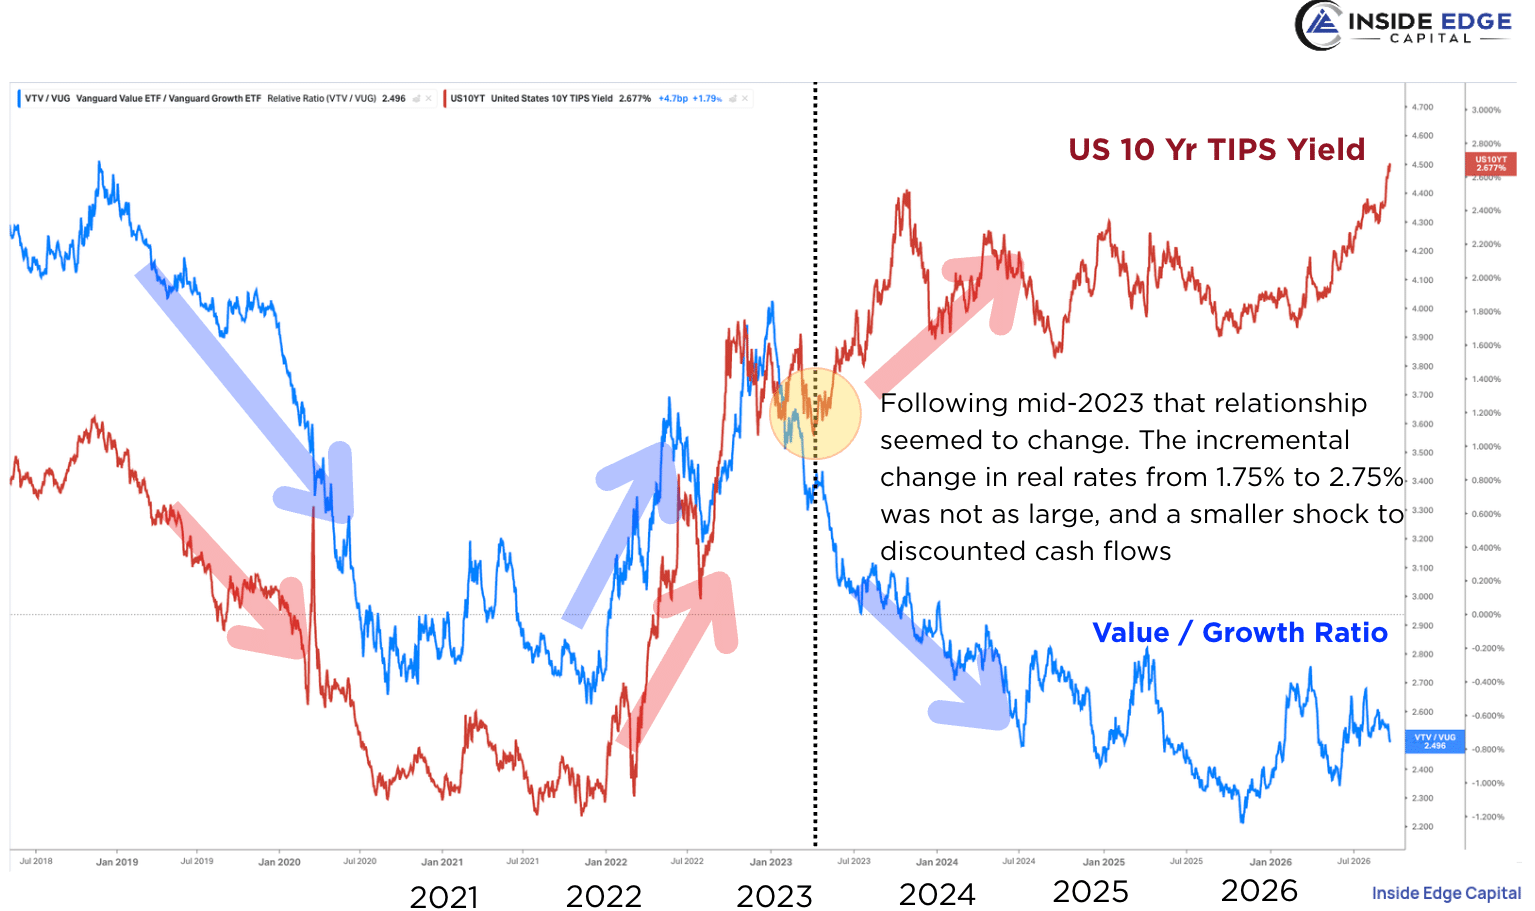
For most of the post-COVID cycle, one chart told you just about everything you needed to know about style leadership, which was the ratio of the Vanguard Value ETF to Vanguard Growth ETF (VTV/VUG) ratio overlaid with the 10-year Treasury TIPS yield, which is the real rate (treasury yield minus expected inflation) For years, the two moved together with a very tight correlation and the reasoning behind it was pretty simple to grasp.

When real rates collapsed into the pandemic, the long-dated cash flows of growth stocks became worth a lot more today, and growth crushed value. Then inflation took off, the Fed started chasing it, and real yields ripped higher. Value took the lead as the economy worked through a post-pandemic growth slowdown. Investors marked down what they’d pay today for growth stocks’ earnings far into the future.
The size of that move is key. The 10-year TIPS yield went from roughly -1.2% in 2021 to around 1.5% by late 2022. Going from deeply negative real rates to meaningfully positive ones is a massive repricing of every discounted cash flow model followed by the analyst community. That became a real chokehold on growth.
Then, around mid-2023, that relationship broke. Real rates kept climbing, and value/growth went the other way. I think the reason was the incremental move in yields, that leg-up in real rates from about 1.75% to 2.75%. That wasn’t the same shock as going from negative to positive. Once the market repriced for positive real rates, another 100 bps increase of real yield didn’t carry the same weight.
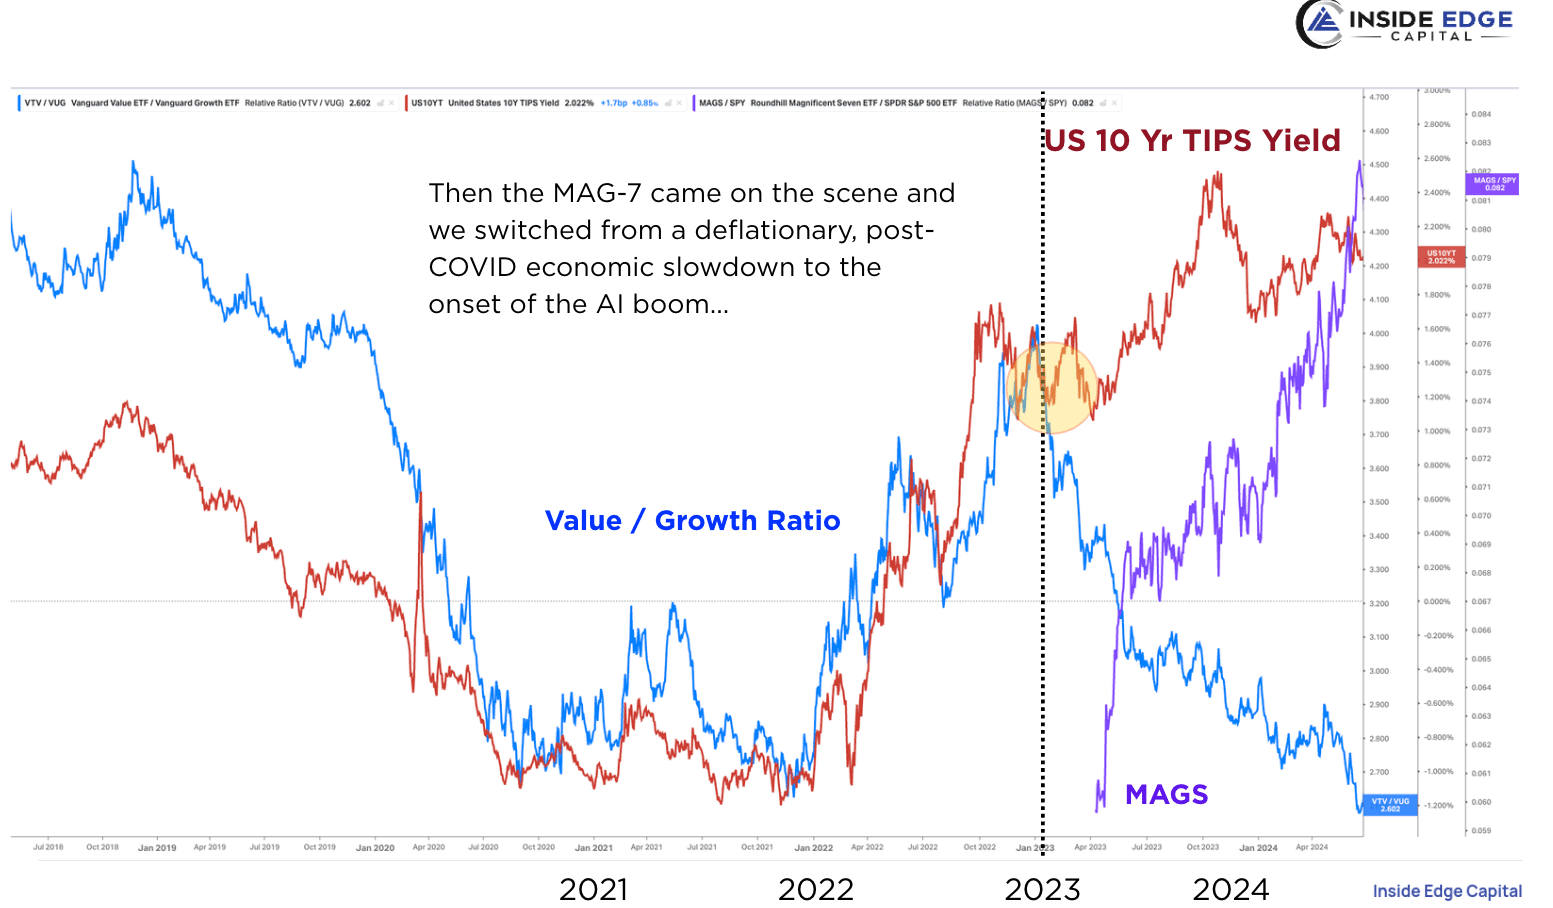
A strong dynamic that propelled this was the Magnificent-7 entering the mix, and the narrative flipped from a post-COVID slowdown to the start of the AI boom. The purple line is the Roundhill Magnificent Seven ETF (MAGS), relative to the S&P 500. It went more or less straight up while value/growth went straight down, with real rates grinding higher the whole time. Let’s fast forward to today.
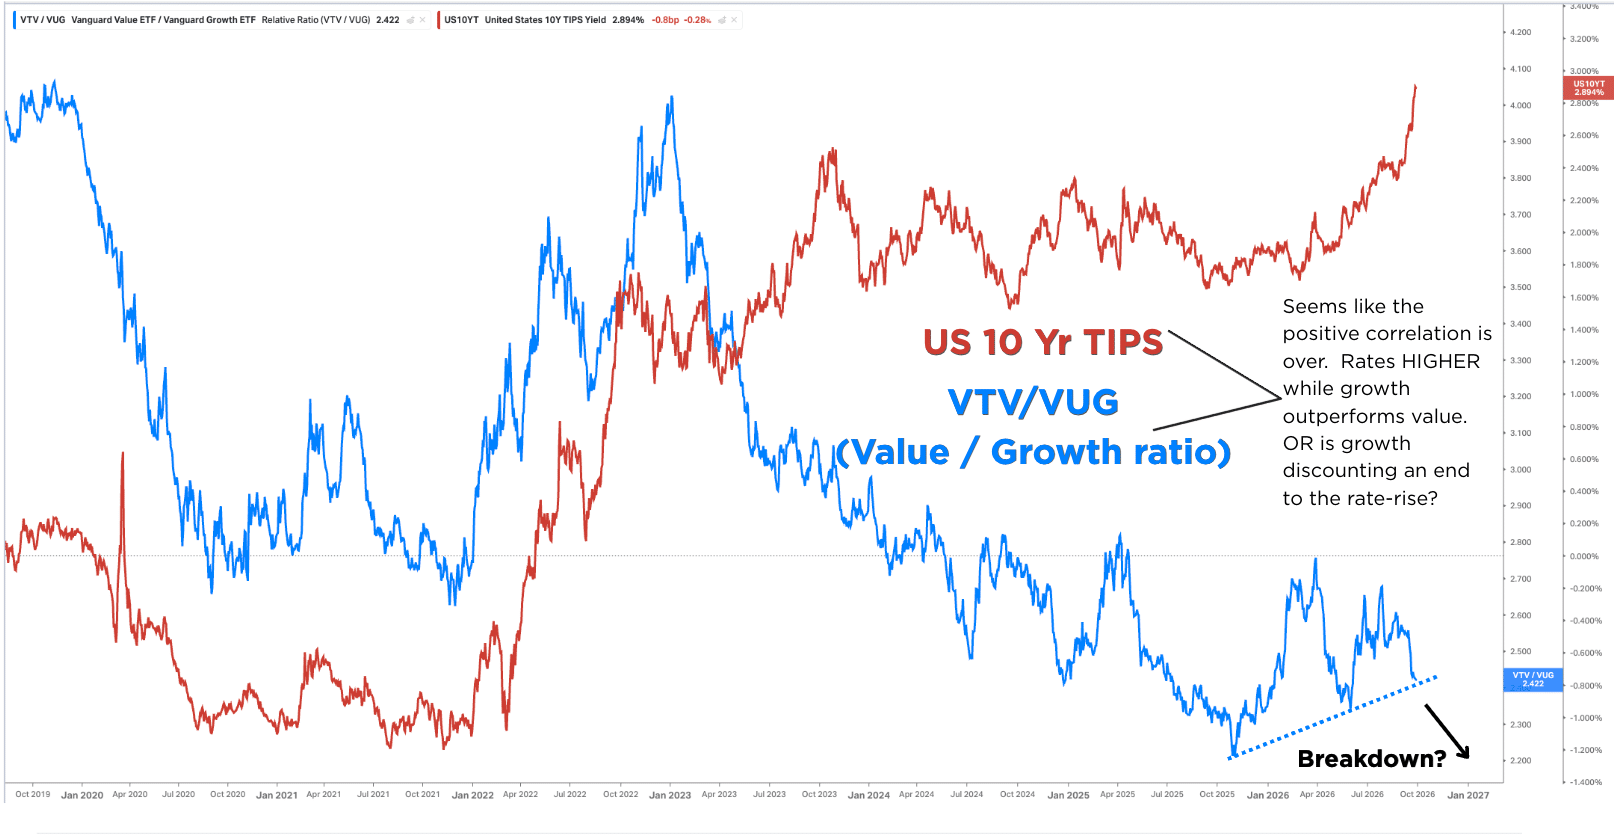
The 10-year TIPS yield is back around 2.894%, up about a full percentage point since early this year. By the 2022 playbook, that’s a signal to sell growth and buy value. It hasn’t played out that way. Value/growth has made a series of higher lows since last fall, and that dotted line is worth watching, but a full point higher on real rates hasn’t produced anything close to the growth beat down we saw in 2022.
If rising yields were an inflation scare, I’d expect growth to be getting hit but we’re just not seeing that. So either growth is discounting an end to the increase in rates that’s mostly about energy supply causing the Fed to hike rates, or something else is going on. Maybe the growth leaders get favorable financing on the strength of their balance sheets no matter what the prevailing borrowing costs are or maybe the AI trade simply becomes the market’s new safe haven, which is a place for investors to hide, not the thing they want to sell. Either way I think the corporate earnings side of the equation is very strong despite the macro headwinds. I think Nvidia’s stock buyback is reaffirming this outlook.
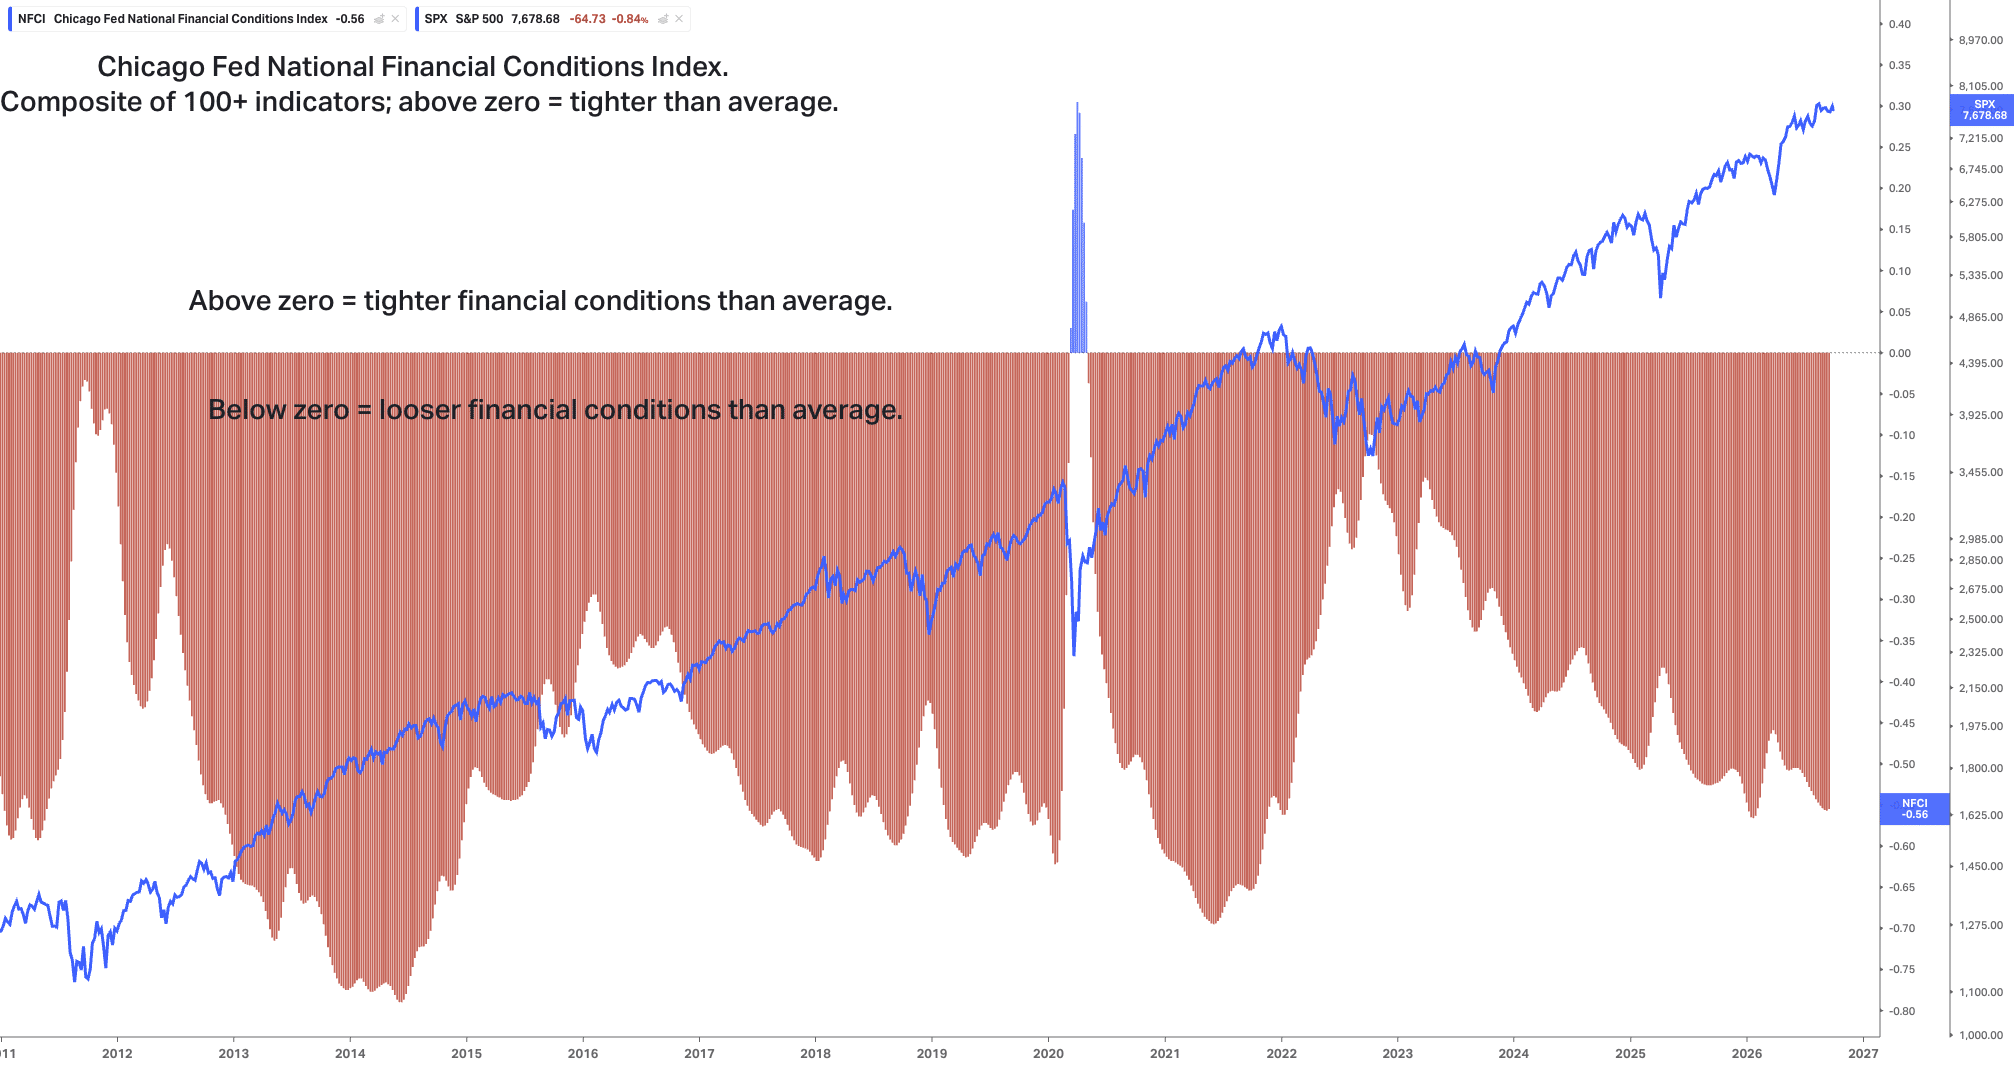
The Chicago Fed’s National Financial Conditions Index is a composite of more than 100 measures of risk, credit, and leverage. Anything above zero means conditions are tighter than average. It’s sitting at -0.56, which is loose and nowhere near stress. High-yield and corporate-to-treasury spreads have ticked up a bit, but nothing significant. Higher yields haven’t broken anything.
That leads me to think the move up in yields is more of a vote on positive future growth than a warning. Investors don’t want the safety of Treasuries right now, and Treasuries are competing for capital with a wave of AI-related corporate debt as the hyperscalers borrow to fund the buildout. Maybe the old relationship between value and growth and real rates is broken, and maybe we’re better off for it. A market where growth can absorb higher real rates is a market with earnings power behind it, not just cheap money.
The confirmation for me is back two charts above, with that small rising trend line in value/growth. If it breaks down to about 2.4 with yields remaining at elevated levels ahead of the Fed’s additional tightening events, then it’s confirming this analysis and it should be risk-on to new all-time highs. Or, if the old relationship of higher yields and higher value/growth ratio holds that trendline and turns higher, we’re back into protection mode and I’m going to need to make some quick moves to protect the portfolios by raising cash and moving to lower-beta, value-oriented names.
We need to be eyes wide open here ready for anything. Remember, our job as active investors is to not predict the future, but thoroughly assess the current market environment and lay out multiple possible playbooks to follow when enough evidence presents itself and suggests it’s time to quickly and calmly make a move.
-Todd Gordon, Founder of Inside Edge Capital Management, LLC
(DISCLOSURES: Todd owns NVDA and within the MAGS holds GOOGL, META, AAPL, AMZN, TSLA personally and for clients of Inside Edge Capital Management, LLC. Charts shown are Koyfin)